Aggregate Functions
Aggregate Functions
In most cases group reports need to display some summary information (such as: “total of a group”, “number of group elements” etc). FastReport provides aggregate functions for calculating aggregate values over some data span.
The aggregate functions are:
| Function |
Description |
| SUM |
returns the total of an expression |
| MIN |
returns the minimal value of an expression |
| MAX |
returns the maximal value of an expression |
| AVG |
returns the average value of an expression |
| COUNT |
returns the number of lines (rows) in the data span |
The syntax of all aggregate functions (except COUNT) is similar to that of the SUM function:
SUM(expression, band, flags)
SUM(expression, band)
SUM(expression)
The parameters are:
expression – the expression to be calculated
band – the name of the data band within which the calculation is performed
flags – a bit field, with values
1 : include invisible bands in calculation
2 : accumulate the aggregate as a running total
(do not reset the aggregate when the current data span resets)
3 : (both of the two previous options)
An expression is the only mandatory parameter, the other two are optional. Nevertheless, to avoid making mistakes it is recommended that band parameters are always given.
The “COUNT” aggregate function has the following syntax:
COUNT(band, flags)
COUNT(band)
where the parameters have the same meaning as above.
There is a general rule for all aggregate functions: an aggregate can only be calculated over a data band and can only be used in that band’s footer, which can be one of : footer, page footer, group footer, column footer or report footer (summary band).
How do aggregate functions work? We will look at this using our group report example. Let's add some new elements to the report:
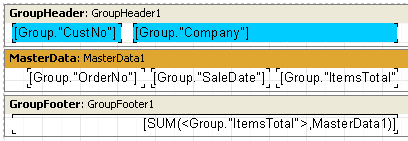
The Group.“ItemsTotal” field in the data band displays the current order total. Place a “Text” object in the group footer containing the aggregate SUM shown above. It will display the total of all orders placed by the given customer. Using a calculator, we can check that the result is correct:
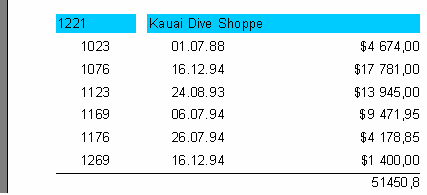
Aggregate functions work like this: before outputting a report, FastReport scans the “Text” object contents to find any aggregate functions. The aggregates found are linked to the data bands in their parameters (in our example “SUM” is linked to the “MasterData1” band). During report output (when the data band is displayed) the values of the aggregates linked to it are calculated. In our case the Group.“ItemsTotal” field values are accumulated. Once the group footer displaying the aggregate has been output the aggregate value is reset to zero, and the cycle is repeated for the next group, and so on.
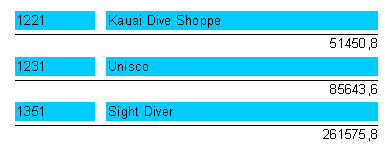
What is the purpose of the optional “Flags” parameter in aggregate functions? Reports may have some, or all, of the data bands hidden. We may, however, need to calculate aggregates over all the data bands, whether visible or not. In our example, set the “Visible” property of the data band to false, so preventing its display. To still have this hidden data band included in the calculations, we have to set the third, optional parameter in the function call to the figure 1, i.e.:
[SUM(<Group."ItemsTotal">,MasterData1,1)]
This produces a report looking like tis:
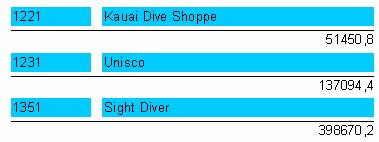
When the “Flags” parameter value is set to 2, the aggregate value is not reset immediately after it is displayed : the aggregate becomes a “running” calculation for each successive output. Let’s modify the function call as shown here:
[SUM(<Group."ItemsTotal">,MasterData1,3)]
The value “3” is a bit combination of “1” and “2”, meaning that we need to include the invisible bands, without resetting the total after each group. As a result, we have:
 It there is a condition for visibility in the "OnBeforePrint" event of a band, flags have no effect.