Printing labels
Printing Labels
In contrast to table-type reports, other reports (such as label printing reports) may have the data arranged one field under another. Let's look at an example of this kind of report which displays data about fish, as in the previous example. The report data is presented as a label and has the following structure:
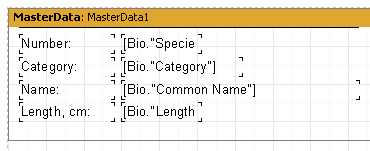
When previewed we would see the following output:
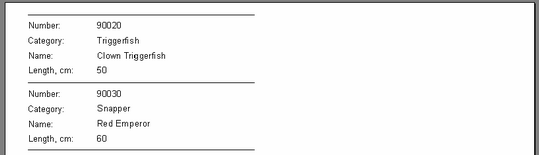
Notice there is a lot of blank space on the right hand side of the page. To make use of the whole page the number of columns in which data is displayed can be set in the report page settings. To do this either double-click on the white space on the design page or use “File>Page Settings...” on the menu.
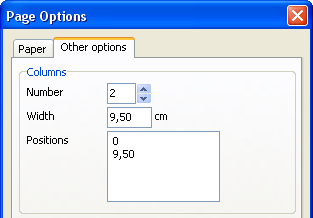
The column count, width and positions are set on the "Other options" tab in the dialogue. In our example only the Number needs to be set at 2, as FastReport adjusts the other options automatically. The column frame is displayed in the designer as a thin vertical line:
The report is now created in the following way. FastReport repeats the “First level data” band as long as there is white space at the bottom of the page. After that, a new column on the same page is created and data bands continue repeating from the top of the new column : this contrasts with simple reports, where a new page is created instead of a new column. When the second column has been filled then a third column is created, and so on - our example only has two columns though. When all of the columns have been filled then FastReport creates a new page and continues displaying data starting in the first column again.
Our two column report should look like this:
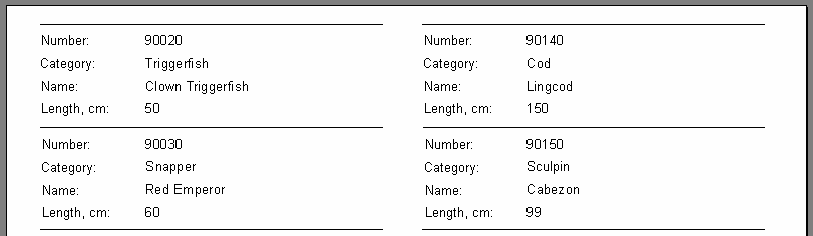
The “Columns” property, available in the object inspector for all data bands, is another way to set the number of columns. If this property is changed from zero however, the number of columns is set only for the selected databand and not for the whole page (as in the previous example). The effect is to display data firstly from 'left-to-right then top-to-bottom', in contrast to the 'top-to-bottom then left-to-the right' output shown above.
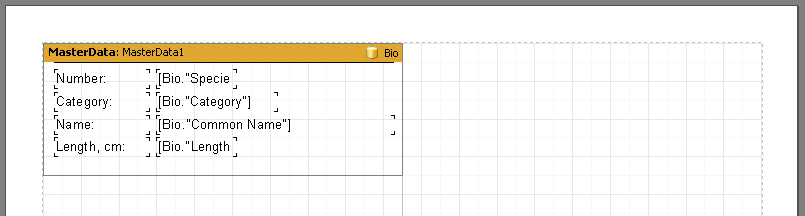
Disable the columns in the Page Options dialogue (set Column Number to 1) and enter 2 in the databand “Columns” property. Note that the “ColumnWidth” property must also be changed from the default zero to prevent column 2 overlaying column 1; optionally the “Column Gap” property can also be changed. FastReport then shows the column frames as dotted lines :
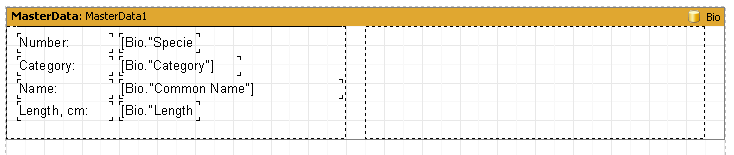
This design displays data in 'left-to-right then top-to-bottom' order.